Recess is Cancelled Site
Location on Google Earth (light blue marker):

Closer View:

Group Members and tasks:
- Nica — Salinity and Plants
- Evan — Animals, Temperature, and Turbidity.
- Sophie — Dissolved Oxygen and BOD
- Miriam — Nitrogen Compounds (Nitrite, Nitrate, and Ammonia)
- Cale — Bacteria and pH
Our group, along with the group Sub-Pixels, measure certain water quality parameters and take small water samples from Little River. Little River contains a pond that has a bridge built over part of it. Recess Is Cancelled (our group) collects data and runs tests on the water to the immediate right side of the bridge, AND from a separate pond far to the right, which is connected to the first pond by a medium-long, meandering river. Reaching this second pond requires us to walk through an area of plants and thorns.
In the picture below you can see the pond with the bridge/deck built over it. Again, our group studies the water to the right of the bridge, (the visible side in this picture).

To understand where the OTHER pond is with respect to this picture, imagine turning to your right. Walk straight, and you'll come to the edge of a smaller pond.
Data Trends
Animals
Our group has spotted the Red-winged Blackbird and the American Robin, and probably other birds that flew away too quickly for us to take a photo of or identify. In our trips to the site during the Winter, there were barely any big animals in the water, but now that Spring has arrived, we have seen the Canada Goose and many Mallard Ducks. The branches on some of the trees have teeth marks on them, which could be a sign that a rabbit was previously there.
In our visit on May 13th, we spotted two of the same kind of huge Koi Fish! (Not huge, but huge for fish in a small pond like that. They were about 2 feet long each).
Pictures of Ducks

Mallard Ducks
Plants
Our site is covered in small trees, tall grassy plants, blackberry bushes and other thorn bushes, that are difficult to navigate around.
Hay
Since it has become Springtime, more long, papery grass, new, shorter thin bright green grass, and even more thorny blackberry bushes have grown up, making the process of cutting a path long and painfully spiky. The green grass grows closer to the brook, while the papery grass is everywhere, but especially thick by the path, along with a layer of dead grey and black leaves.
We've identified a number of blackberry bushes, a black willow, and a red maple.
Red Maple
Water Quality Testing
The water quality parameters that we have been measuring are Temperature, Turbidity, Salinity, Coliform Bacteria, pH, Dissolved Oxygen(DO), Ammonia, Nitrite, Nitrate, and Biochemical Oxygen Demand(BOD). The parameters that do not directly involve the pond or a water sample involve identifying Plants and Animals, of which our findings were presented above.
Temperature
The pond has fluctuated a bit in temperature in the different times we have been to it. It has been within the Fahrenheit range of high 30s to low 50s. When analyzing this data, it is important to note that we began our trips to the site in the Winter, and now it is Springtime, so naturally the water should be warming up.
Turbidity
Close-up of the smaller pond in the Winter
The picture above was taken in the Winter, when the water was very turbid. Since then, the turbidity has decreased. This means that the water is clearer, and it is easier to see the bottom of the pond. This tells us that there is not too much algae. However, the water is still somewhat turbid, so there probably is some plant life in the water, but not necessarily on the surface. .jpeg)
One reason to why the turbidity decreased is that as the weather warmed up, snow melted and may have dripped into the pond, diluting it. There is more rainfall in the spring, and this also dilutes the water.
Salinity
Salinity is the ratio of salt in water to the amount of water. Specifically, it is measured in ppt (parts per thousand). It is important to study the salinity in water because of the bad effects on fresh water wildlife that can happen if the salinity level increases too rapidly. Animals that are not adapted to saltwater will often die of dehydration, because their bodies try to even the amount of salt inside them with the amount outside, pushing out their own body fluid to achieve this.
If overly salty water seeps into the soil, plants will absorb it. Too much salt can harm plants and sometimes kill them.
If overly salty water seeps into the soil, plants will absorb it. Too much salt can harm plants and sometimes kill them.
The first time we tested the salinity of the water at alewife brook, we got a measurement of 1 ppt. However, the optimal parameter for fresh water is 0. The second time we tested, on the salinity, we got 2 ppt. In about three weeks, the salinity changed 1 ppt. (This may have been incorrect, because the next time we tried to test, we discovered that the refractometer we used was stuck at 1.) Luckily, since then we've gotten only 0 every time we test.
Going forward, we are hoping to find that the salinity does not rise, because more animals will be living in and around the brook now that it's warmer.
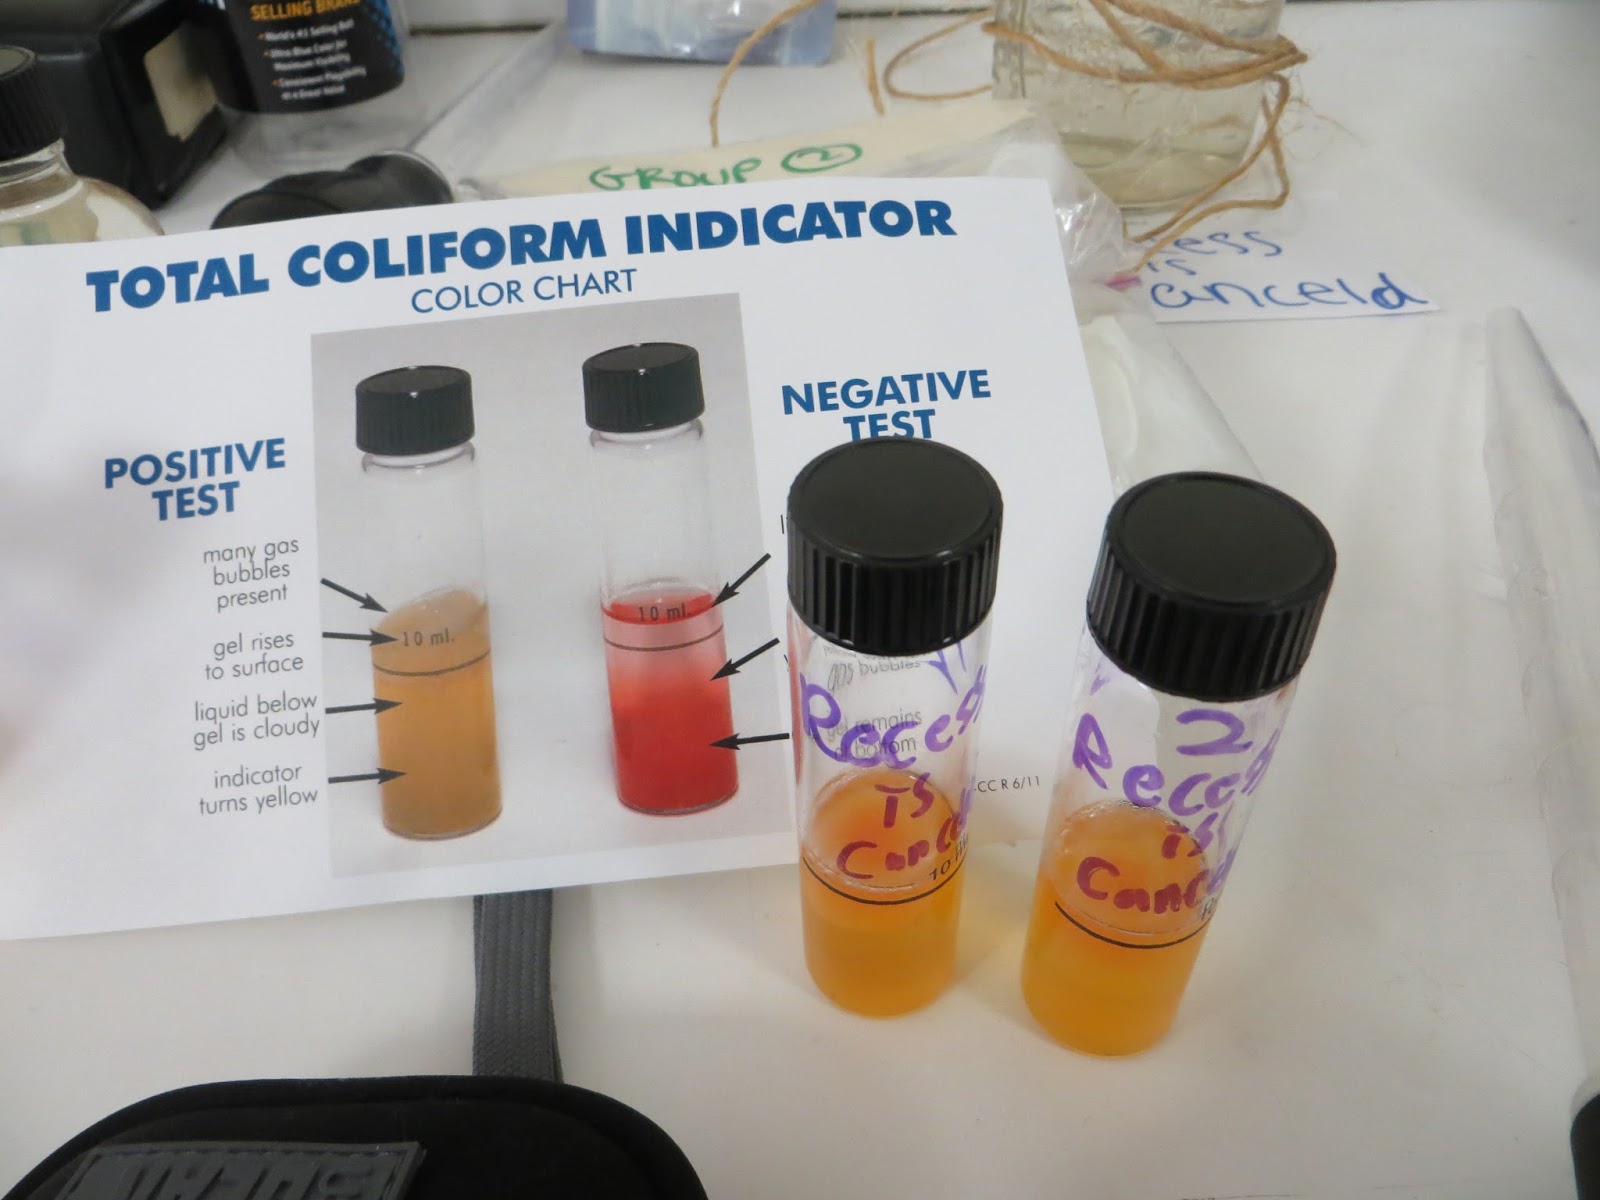
Coliform Bacteria
Coliform Bacteria is in many things including plants, dirt, and animals. However it is most
common in fecal matter. If the test for coliform in water is positive there is specifically a large amount of coliform bacteria in the water. Coliform also can carry diseases. If a water test comes positive for coliform, the water is not safe to drink.
The coliform tested positive in two times, (May 18th 2015 and April 29th 2015). Good thing we didn't drink the water!
pH
pH is the measure of the acidity level of the water. As you can see in the above picture, the pH scale is defined in such a way that the more acidic the water is, the lower the numeric value of the measurement is.
According to our measurements, the pH level of the water in our site hovered around 7.5, except for April 29th, when the test result was 6.6. This one piece of data seems suspicious, and may have been the result of a mistake in the test routine. If it wasn't, though, it either means that the water on average was more acidic on that one day, OR it means that the particular part of the water that the sample was taken from had more pH than the rest of the pond. The acidity in this water would not have been distributed well into the rest of the water. One reason for this could be that an animal had recently urinated into that part of the pond, since urine is slightly acidic.
Dissolved Oxygen
Dissolved Oxygen is measured in ppm (parts per million). Below are our DO test results so far:
| 2/11/2015 | 3/4/2015 | 3/18/2015 | 4/8/2015 | 4/29/2015 | 5/13/2015 |
| Dissolved Oxygen | 17 ppm | N/A | 8.2 ppm | 6.2 ppm | N/A |
When looking at this chart, it is clear that the DO level went down as it became Spring. This is because the level of Dissolved Oxygen is higher in cold water than in warmer water.
Ammonia(NH3) -> Nitrite(NO2) -> Nitrate(NO3)
| 2/11/2015 | 3/4/2015 | 3/18/2015 | 4/8/2015 | 4/29/2015 | 5/13/2015 |
| Ammonia | 0 ppm | .25 ppm | .25 ppm | .5 ppm | 0 ppm | 0.38 ppm |
| Nitrite | 0 ppm | N/A | 0 ppm | 0 ppm | 0 ppm | |
| Nitrate | 5 ppm | N/A | 5 ppm | 5 ppm | 2.5 ppm | 4 ppm |
Ammonia comes from the breakdown of pee. Of these three main nitrogen compounds, Ammonia is the most toxic, Nitrate is the second most toxic, and Nitrate is the third, being not nearly as toxic as the first two. Ammonia can then be changed to Nitrite by bacteria, which can then be changed to Nitrate.
The ammonia level has always stayed well below 1 ppm, which is a good thing, given how toxic it is to many organisms in the water.
The nitrite level in the water at our site has been zero (or very close to zero) every time we have been there, according to our test results.
The nitrate level seemed to hover around 5 ppm in the Winter months, and then decreased in the Spring months (there may not be enough data to infer this, but it seems this way).
Biochemical Oxygen Demand(BOD)
| 2/11/2015 | 3/4/2015 | 3/18/2015 | 4/8/2015 | 4/29/2015 | 5/13/2015 |
| ? | 6.2ppm |
We have one piece of data, from April 8th. BOD is a tough test, because it takes five days. This is probably why we're missing so much data.
We have one last trip left to Alewife Brook. Hopefully we will get a new piece of data for every single parameter. It would definitely help us see trends more clearly!